Progress Report 2
Process
Machining processing induces large strains at high-strain rate and elevated temperatures. A 2D idealization is shown below.
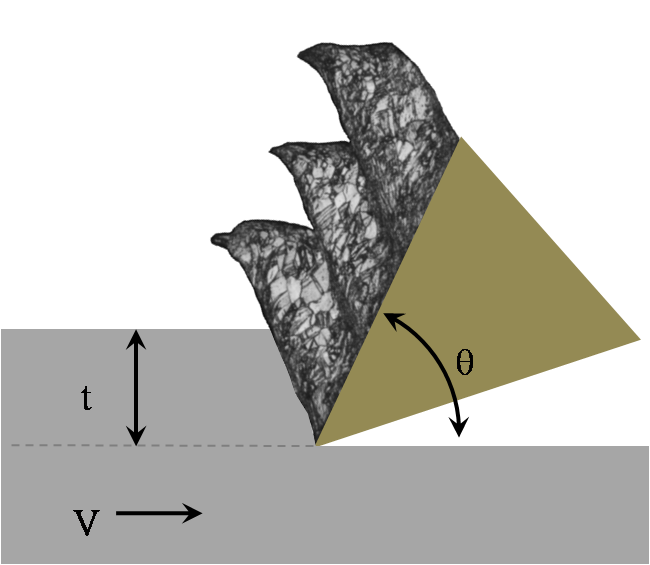
There are three independent variables in each experiment that control strain, rate and temperature in a non-unique fashion,
- Depth of cut (t)
- Machining surface velocity (V)
- Tool angle (\theta)
Approach
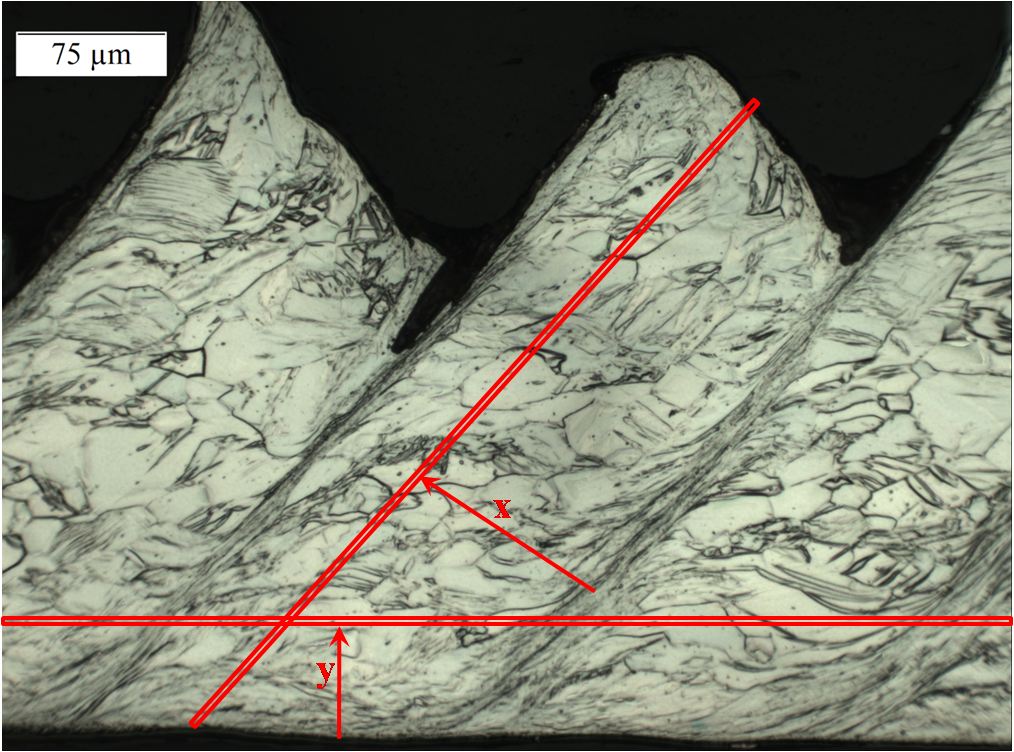
A revised strategy is to address the gradients directly by assuming the following coordinates which are normal to the gradient features.
The plan for quantifying structure statistics is to:
-
Segment micrographs - Processing images to identify phase boundaries (twins or grain boundaries).
-
Quantify statistics - Use n-point statistics to explore process-structure linkages and quantify the relevant microstructure function(s). This will also include reducing the order of the statistics possibly through principal component analysis (PCA).
Deliverables
- Generate segmented data set from micrographs
- Extract pathways in n-point statistic space corresponding to specific processes
Trial Image and Methodology
Initially a trial image will be utilized to develop edge detection and segmentation methodology. The chip chosen corresponds to the following processing conditions (given in machining parameters). The corresponding estimates of strain and rate are also shown.
| Degree of Deformation | Deformation Rate |
|---|---|
| depth of cut =0.1 mm | V = 2.33 m/s |
| strain ~ 0.1-10 | rate = ~10^5 |
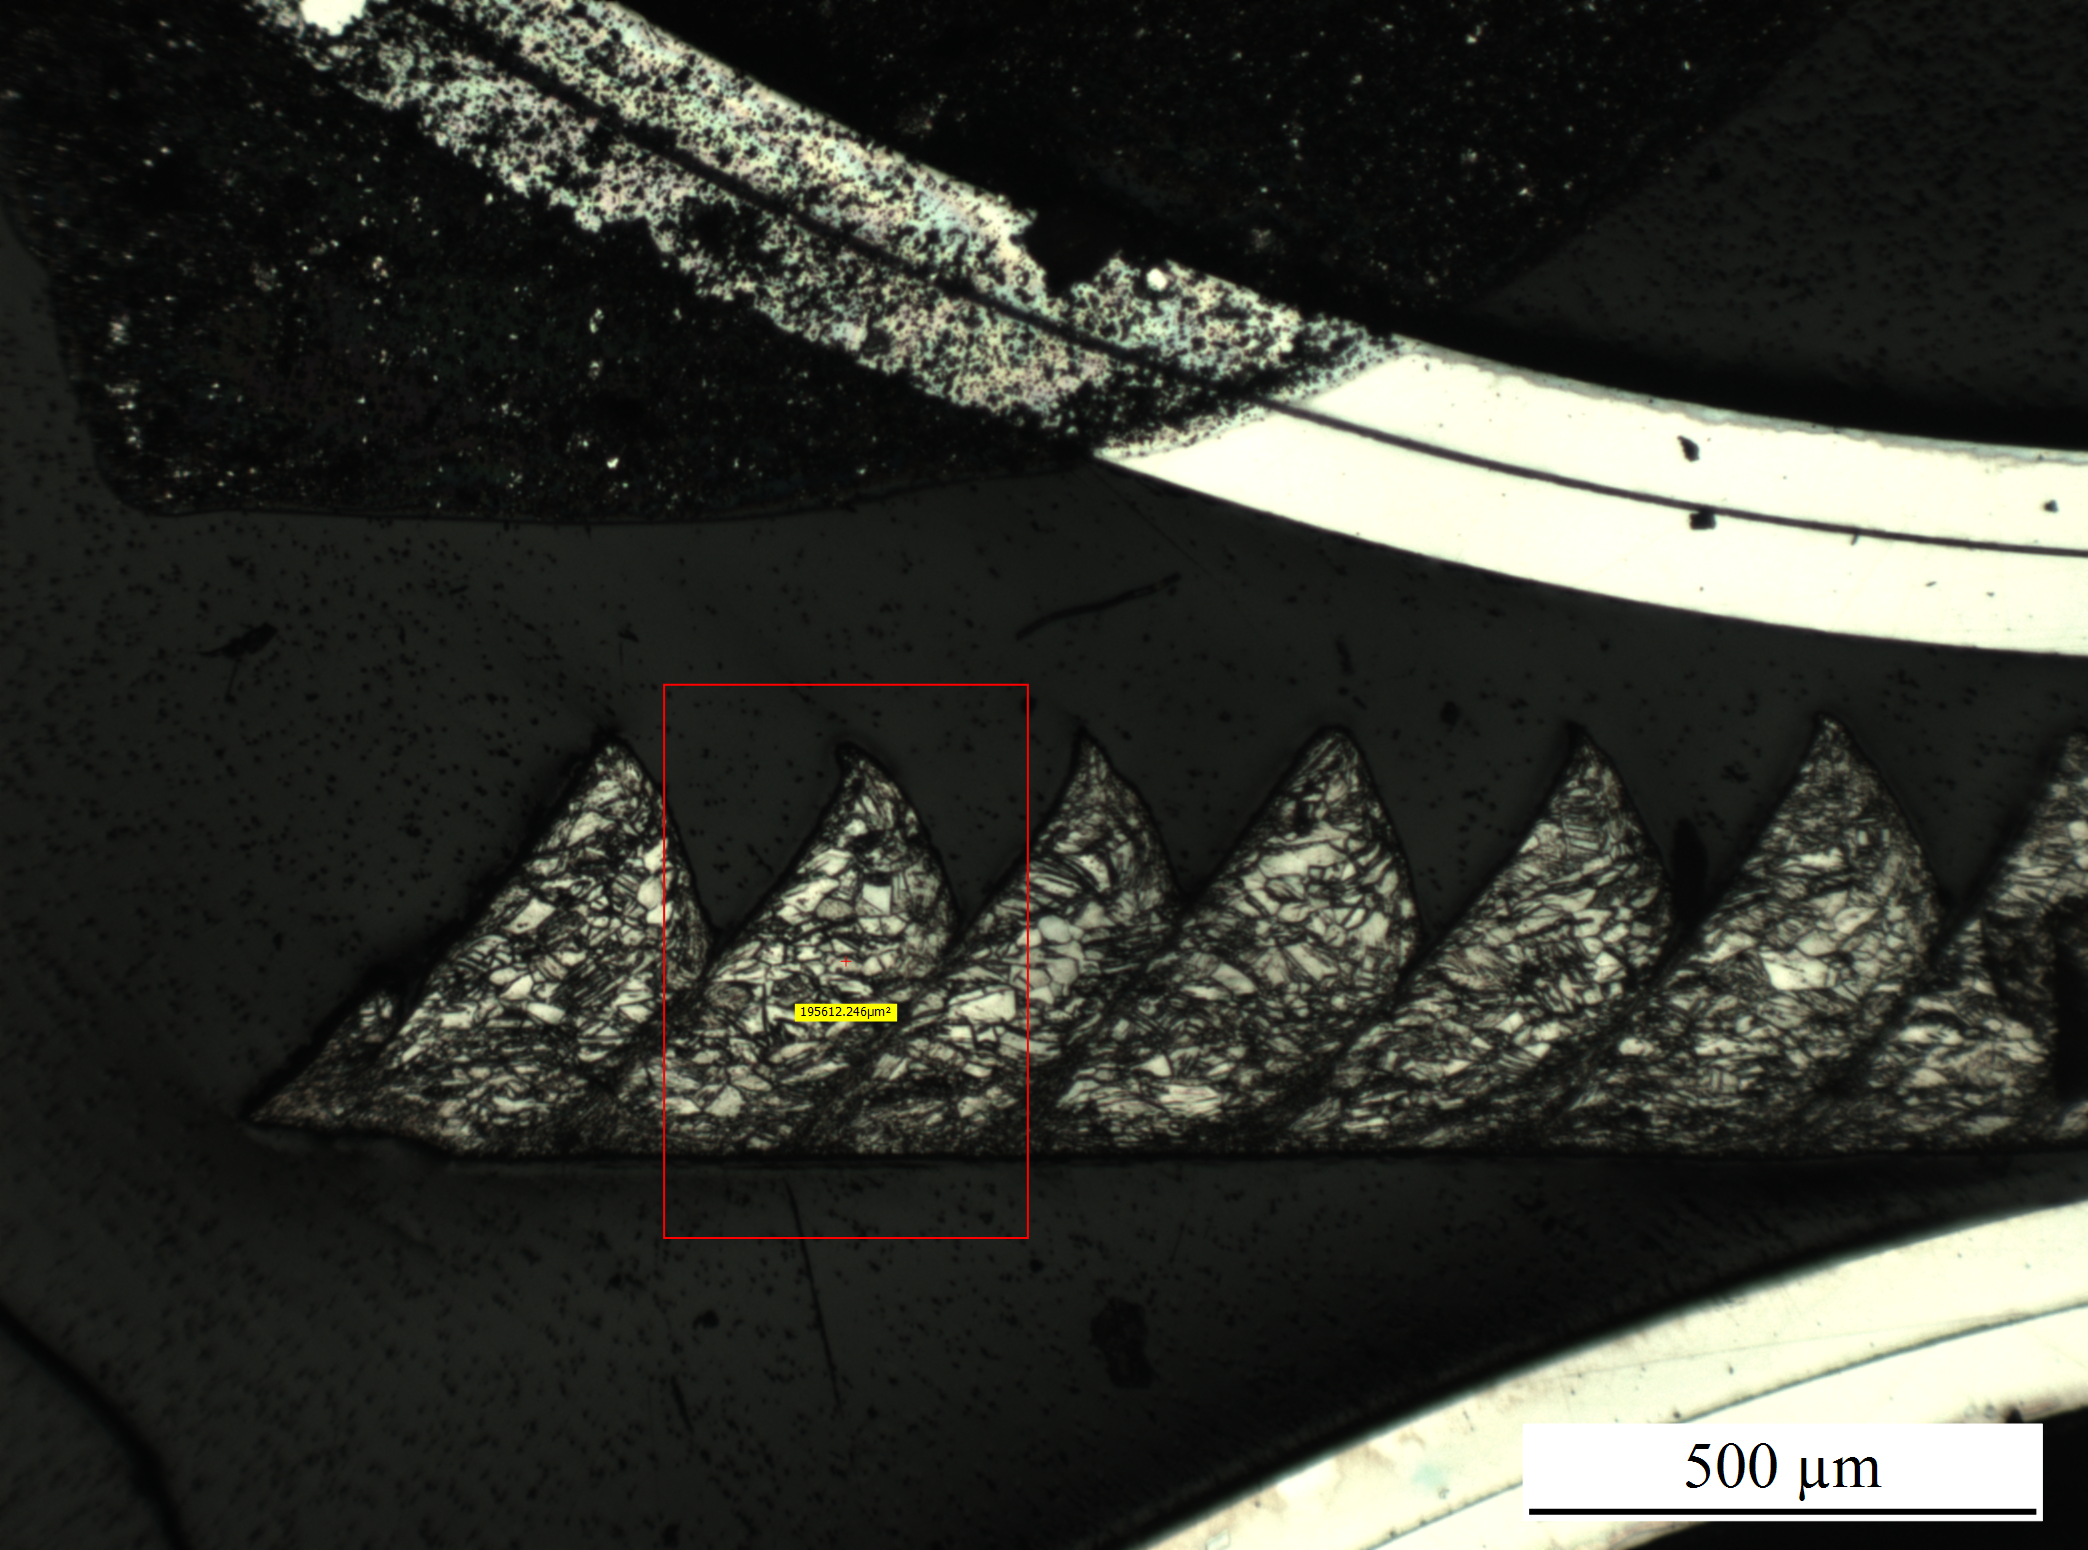
A 5X image and the selected segment are shown below,
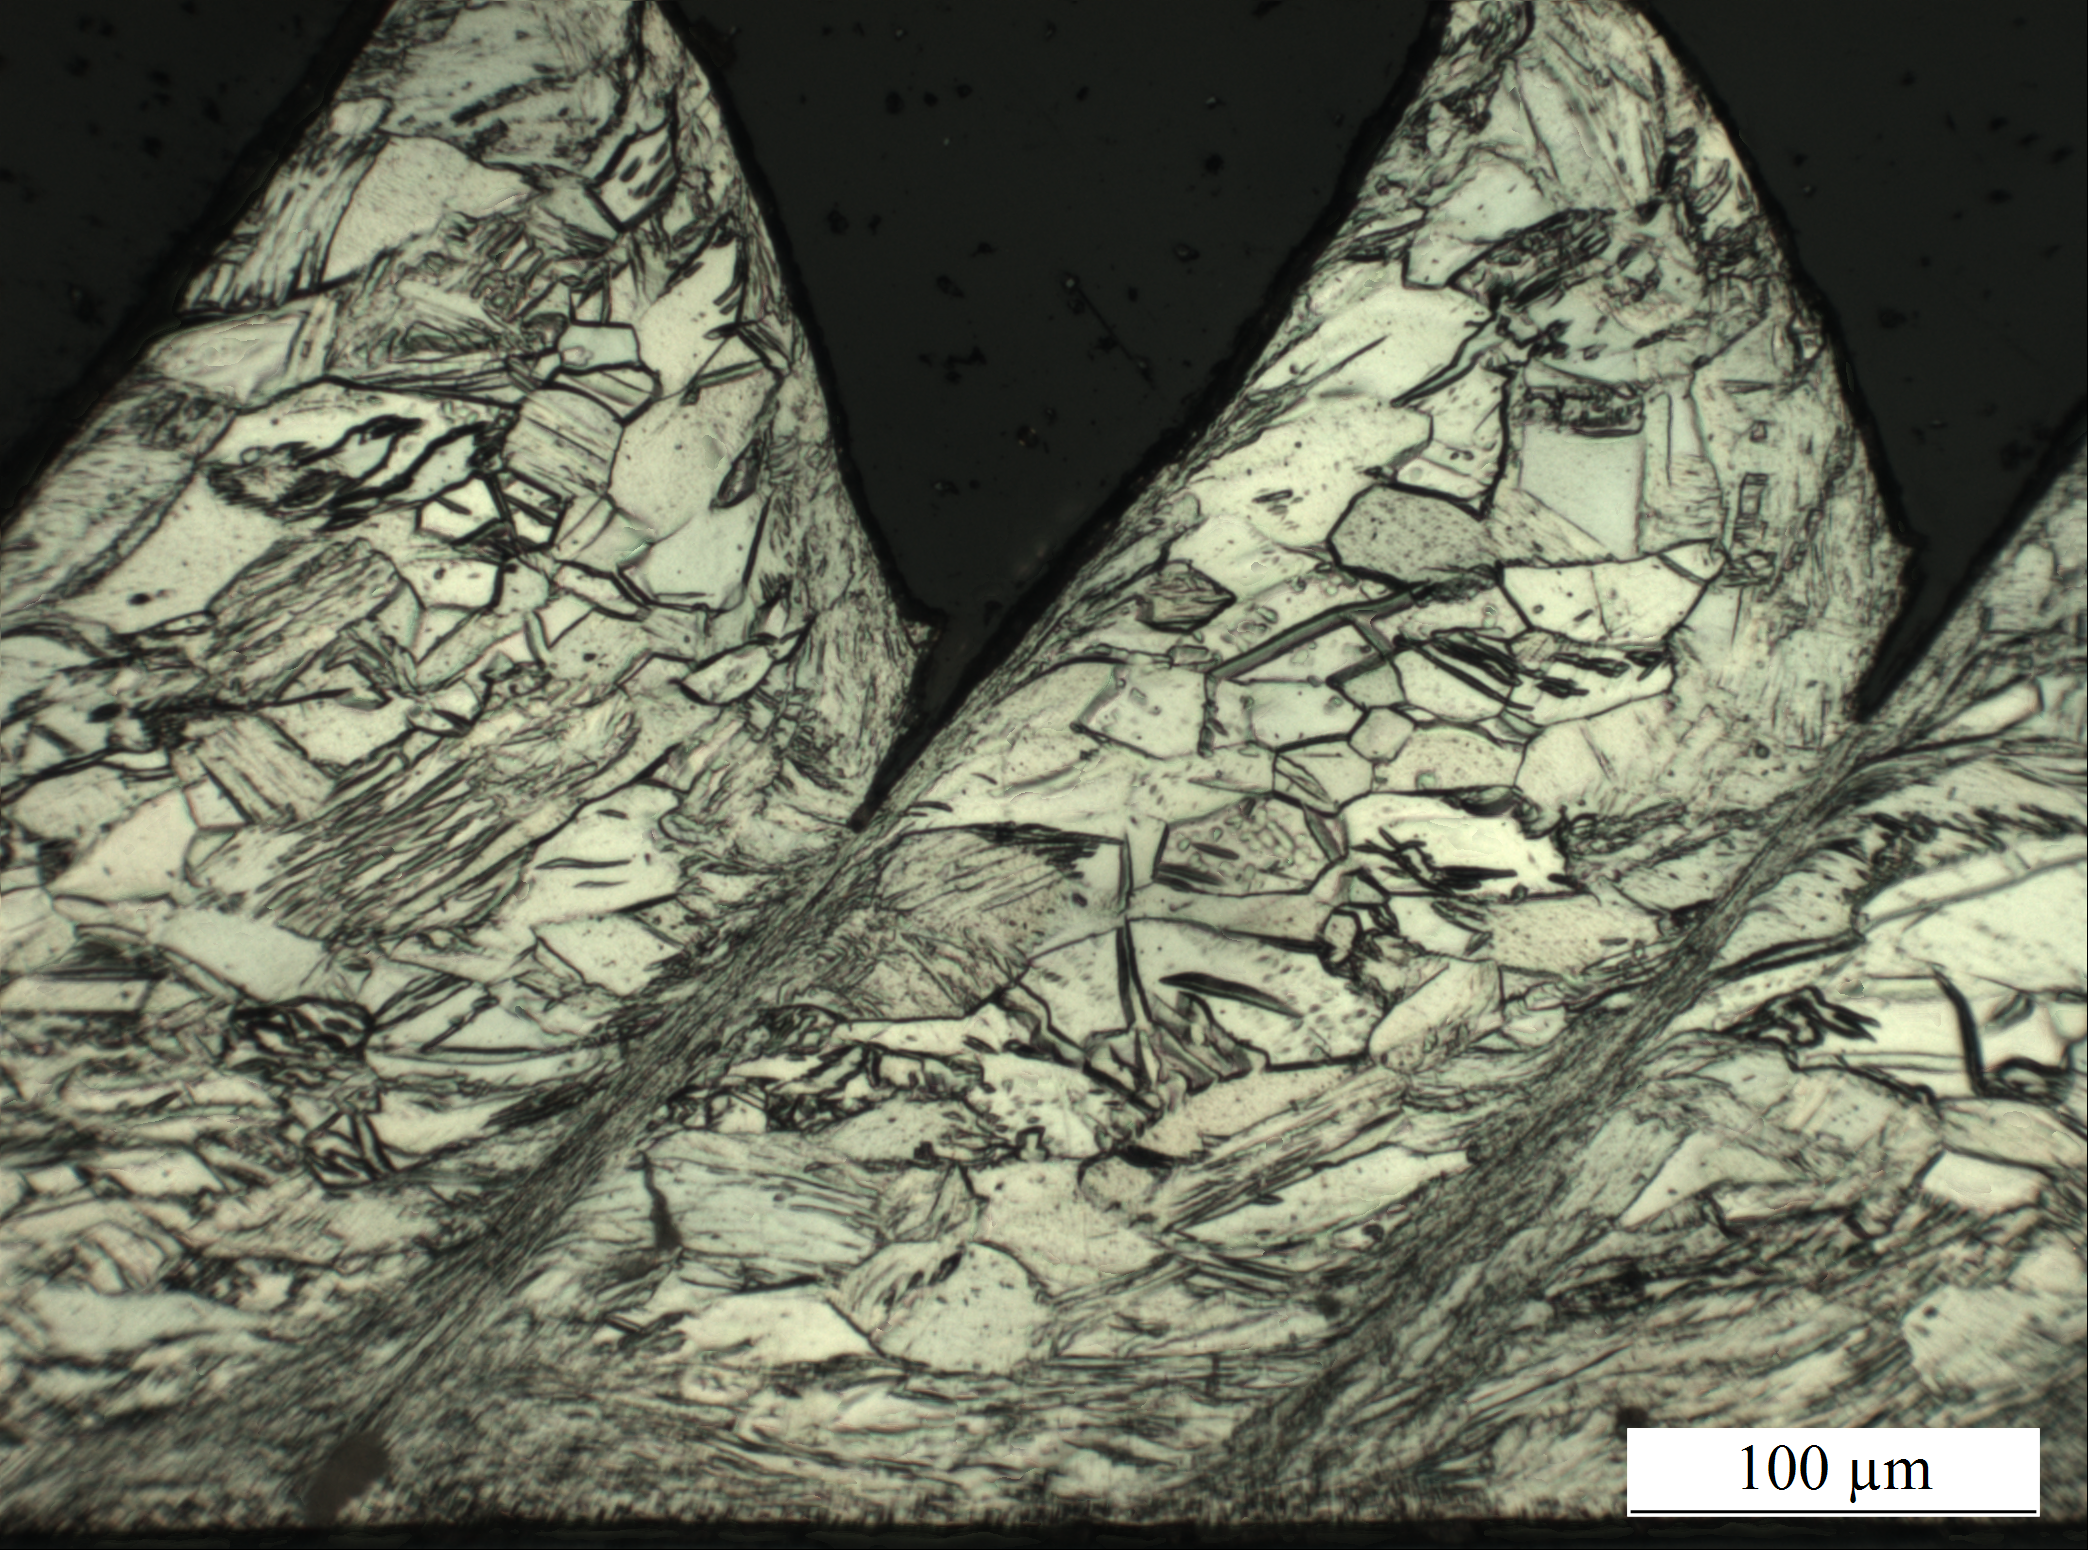
A 20X image of the selected segment is shown below,
Images taken at the highest available resolution (100X) are to be used for edge detection and image segmentation. The dropbox location is
https://www.dropbox.com/sh/ycet38z54770g78/AACLCbNVXNgJnELyGYDhNgGaa?dl=0.
Note that there is a text file “order.txt” which contains the ordering of the images relative to the 20X sample, i.e.,
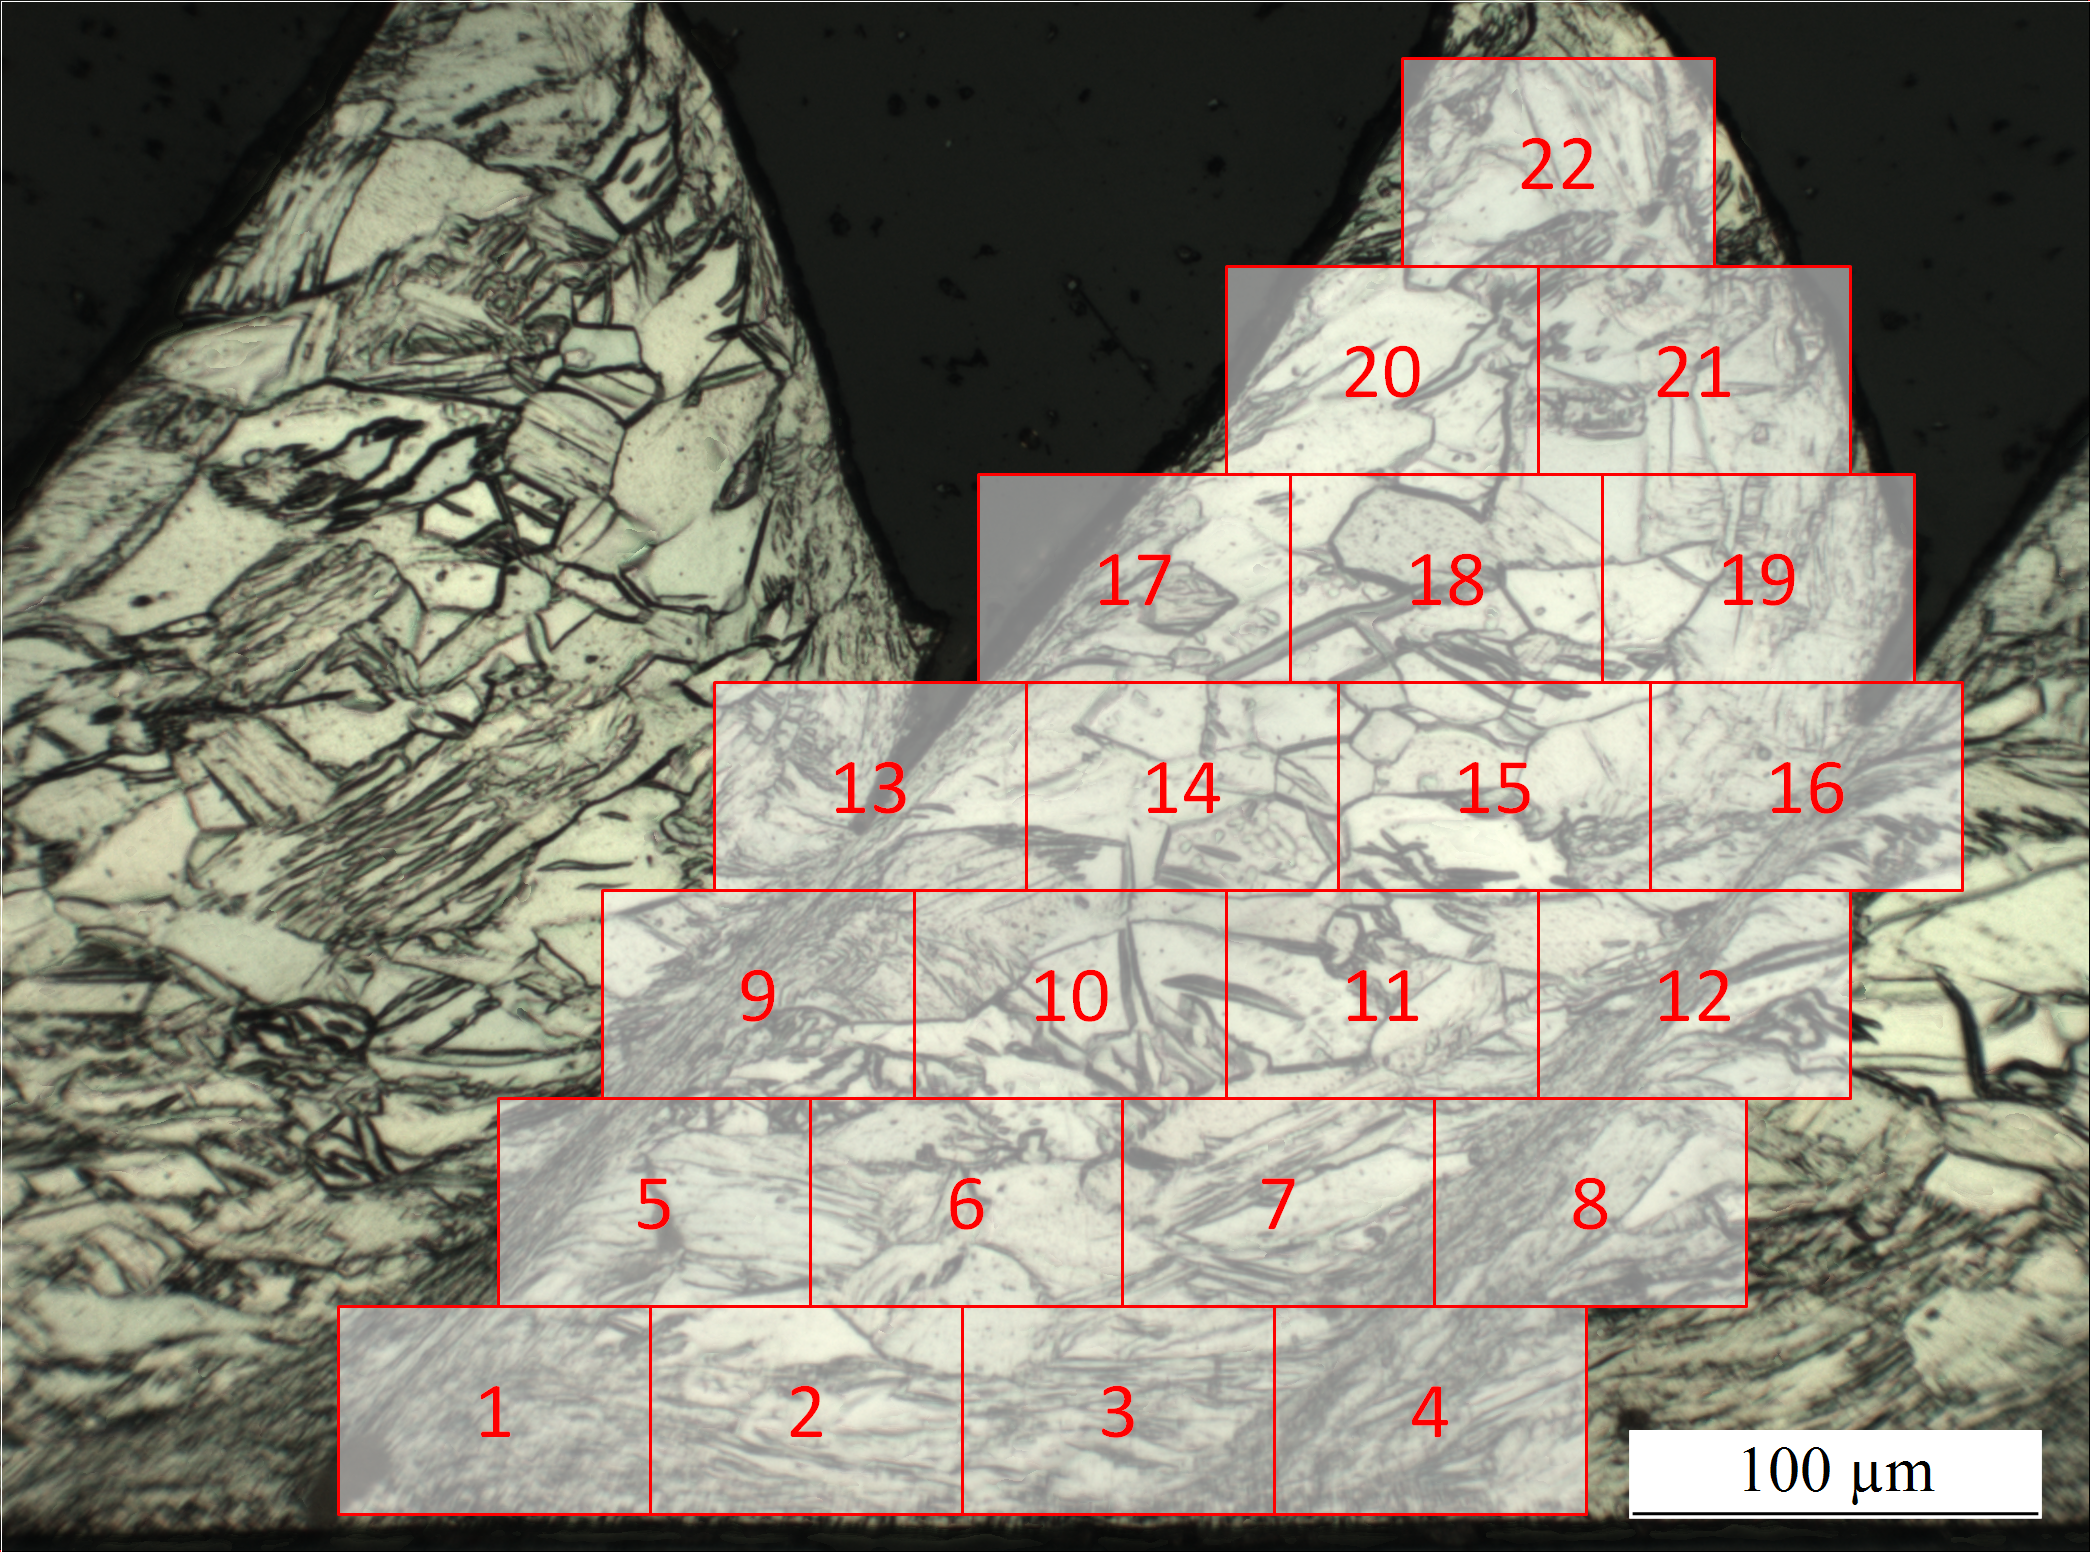
The individual 100X-mag images individually span the entire segmentment. Note that in the above image this is not clear (I got lazy and didn’t want to rescale everything and move all the boxes just to illustrate this point…).
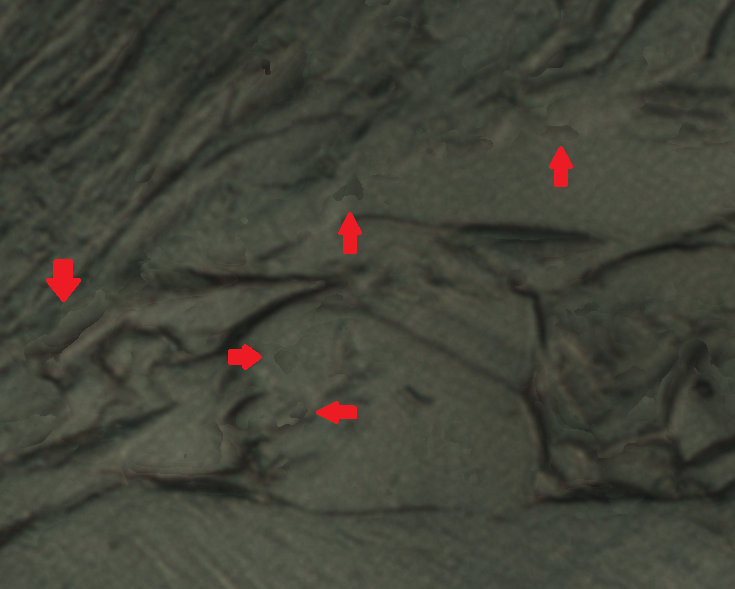
Note that the optical microscope does not have very much depth of field. As such, to capture the entire image in focus, a multifocus feature is used to stitch together several partially-focused images. A concern is that artificially generated edges may be difficult to deal with. As such all images are being retained for comparison.
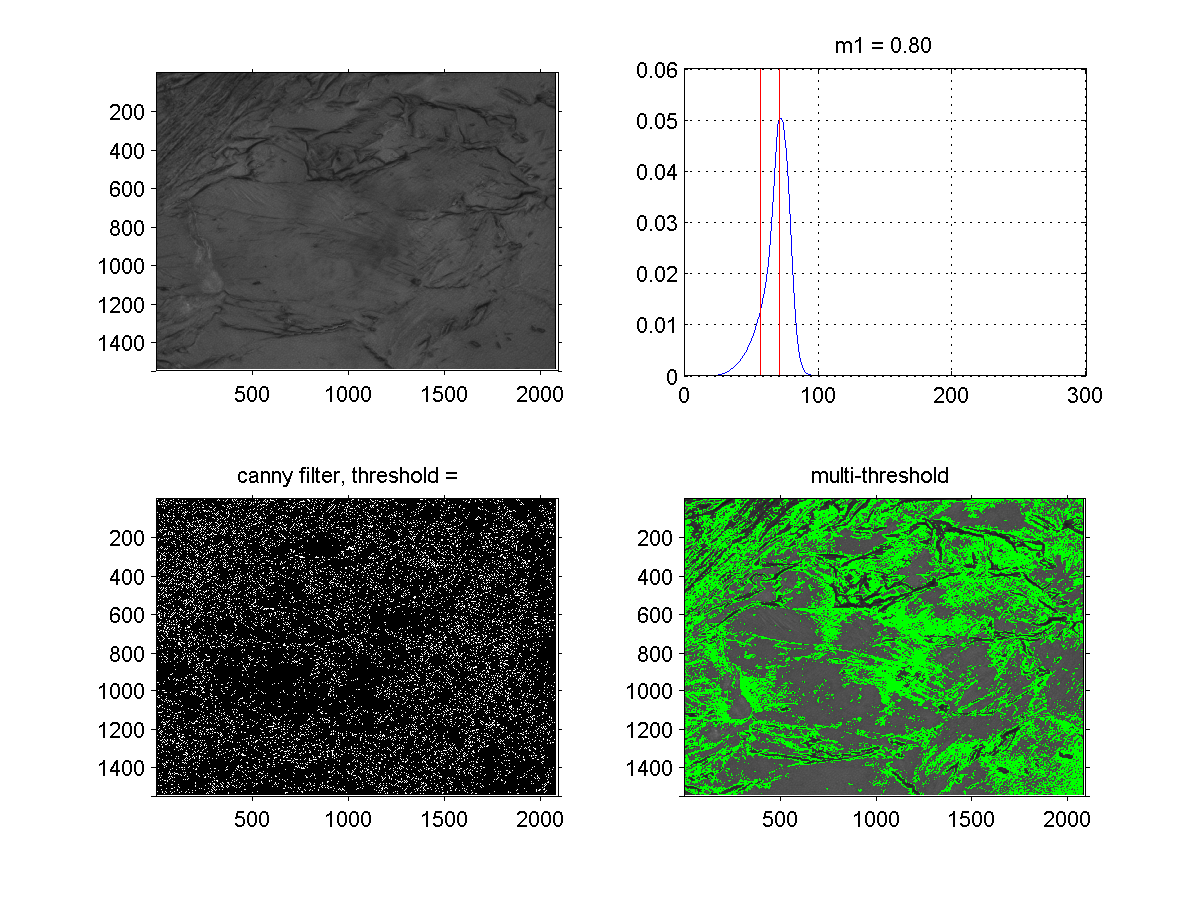
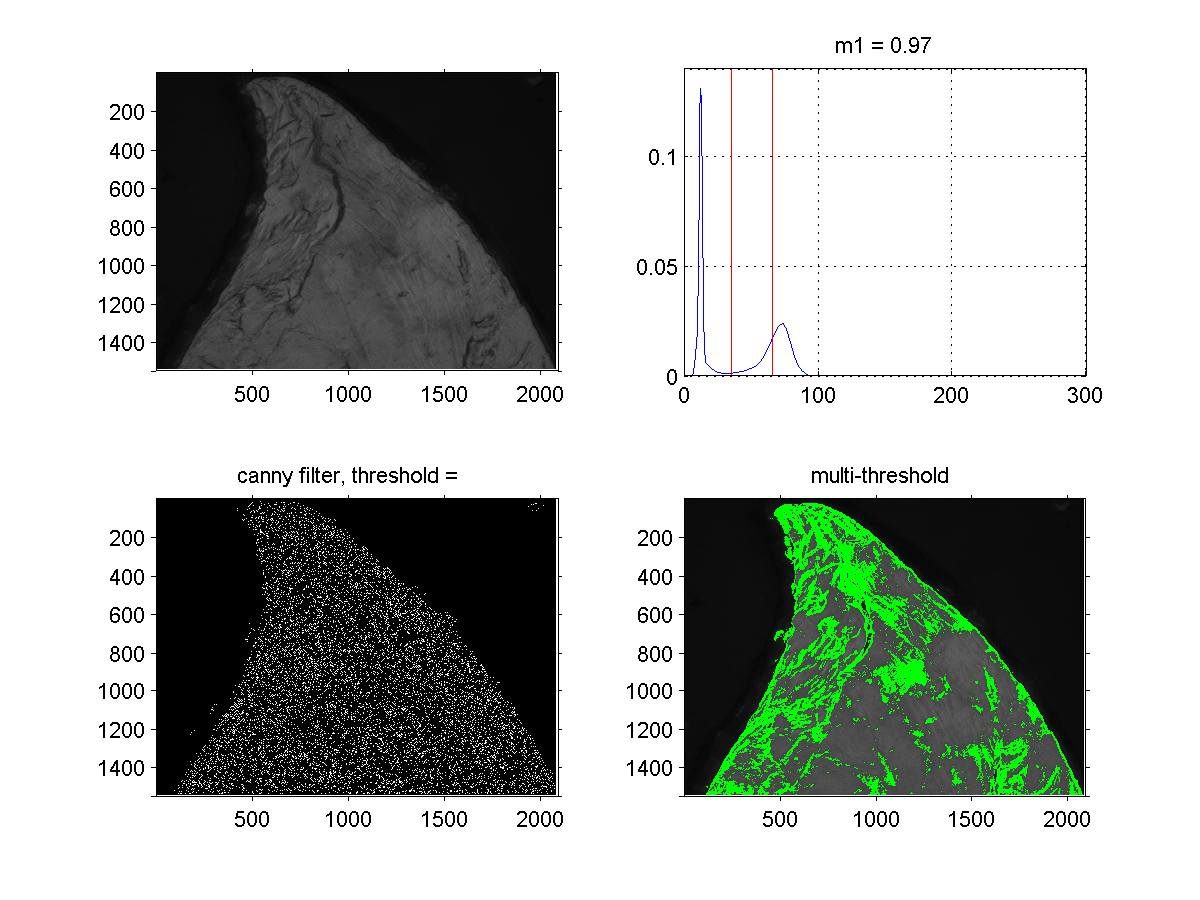
Preliminary edge finding results using a Canny filter are shown below.
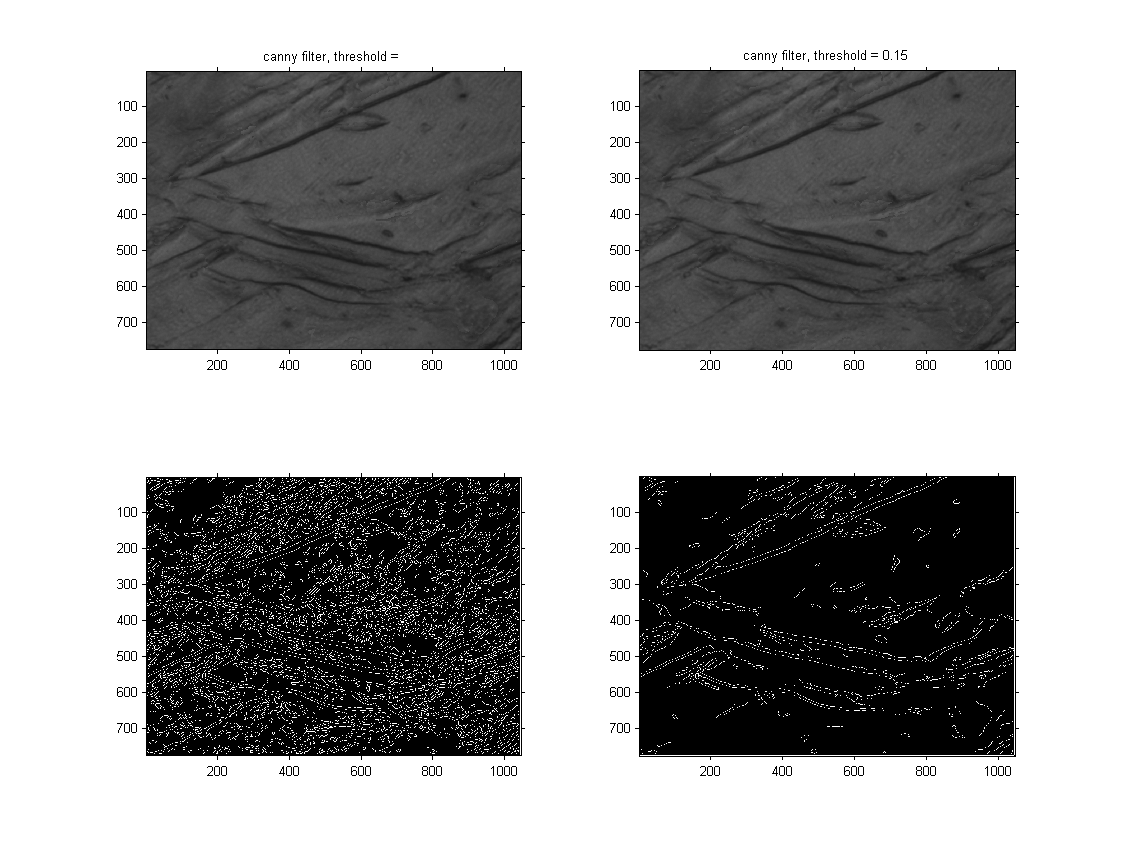
Preliminary thresholding results are shown below.