Updated Problem Statement
Process
Machining processing induces large strains at high-strain rate and elevated temperatures. A 2D idealization is shown below.
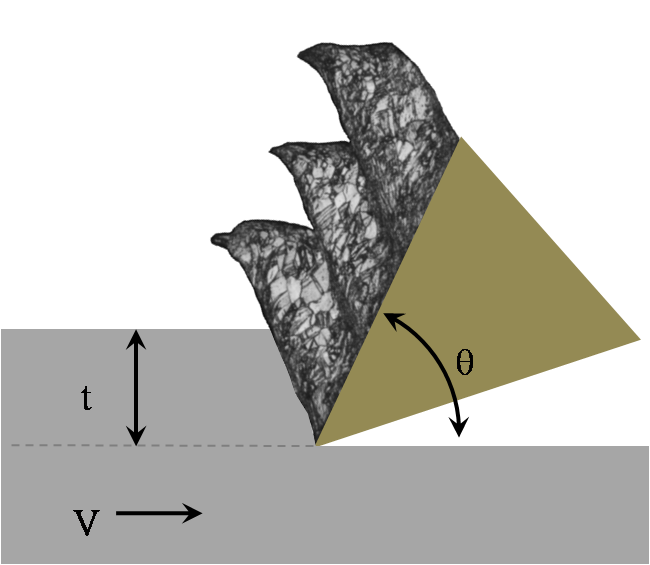
There are three independent variables in each experiment that control strain, rate and temperature in a non-unique fashion,
- Depth of cut (t)
- Machining surface velocity (V)
- Tool angle (\theta)
Structure Changes

- Large range of grain refinement spanning from the initial micrometer scale down to the nanometer scale within shear bands
- Evolution of grain aspect ratio
- Increase in dislocation density at the atomistic scale
- Evolution of grain boundary misorientation
- Twinning
Experimental Data
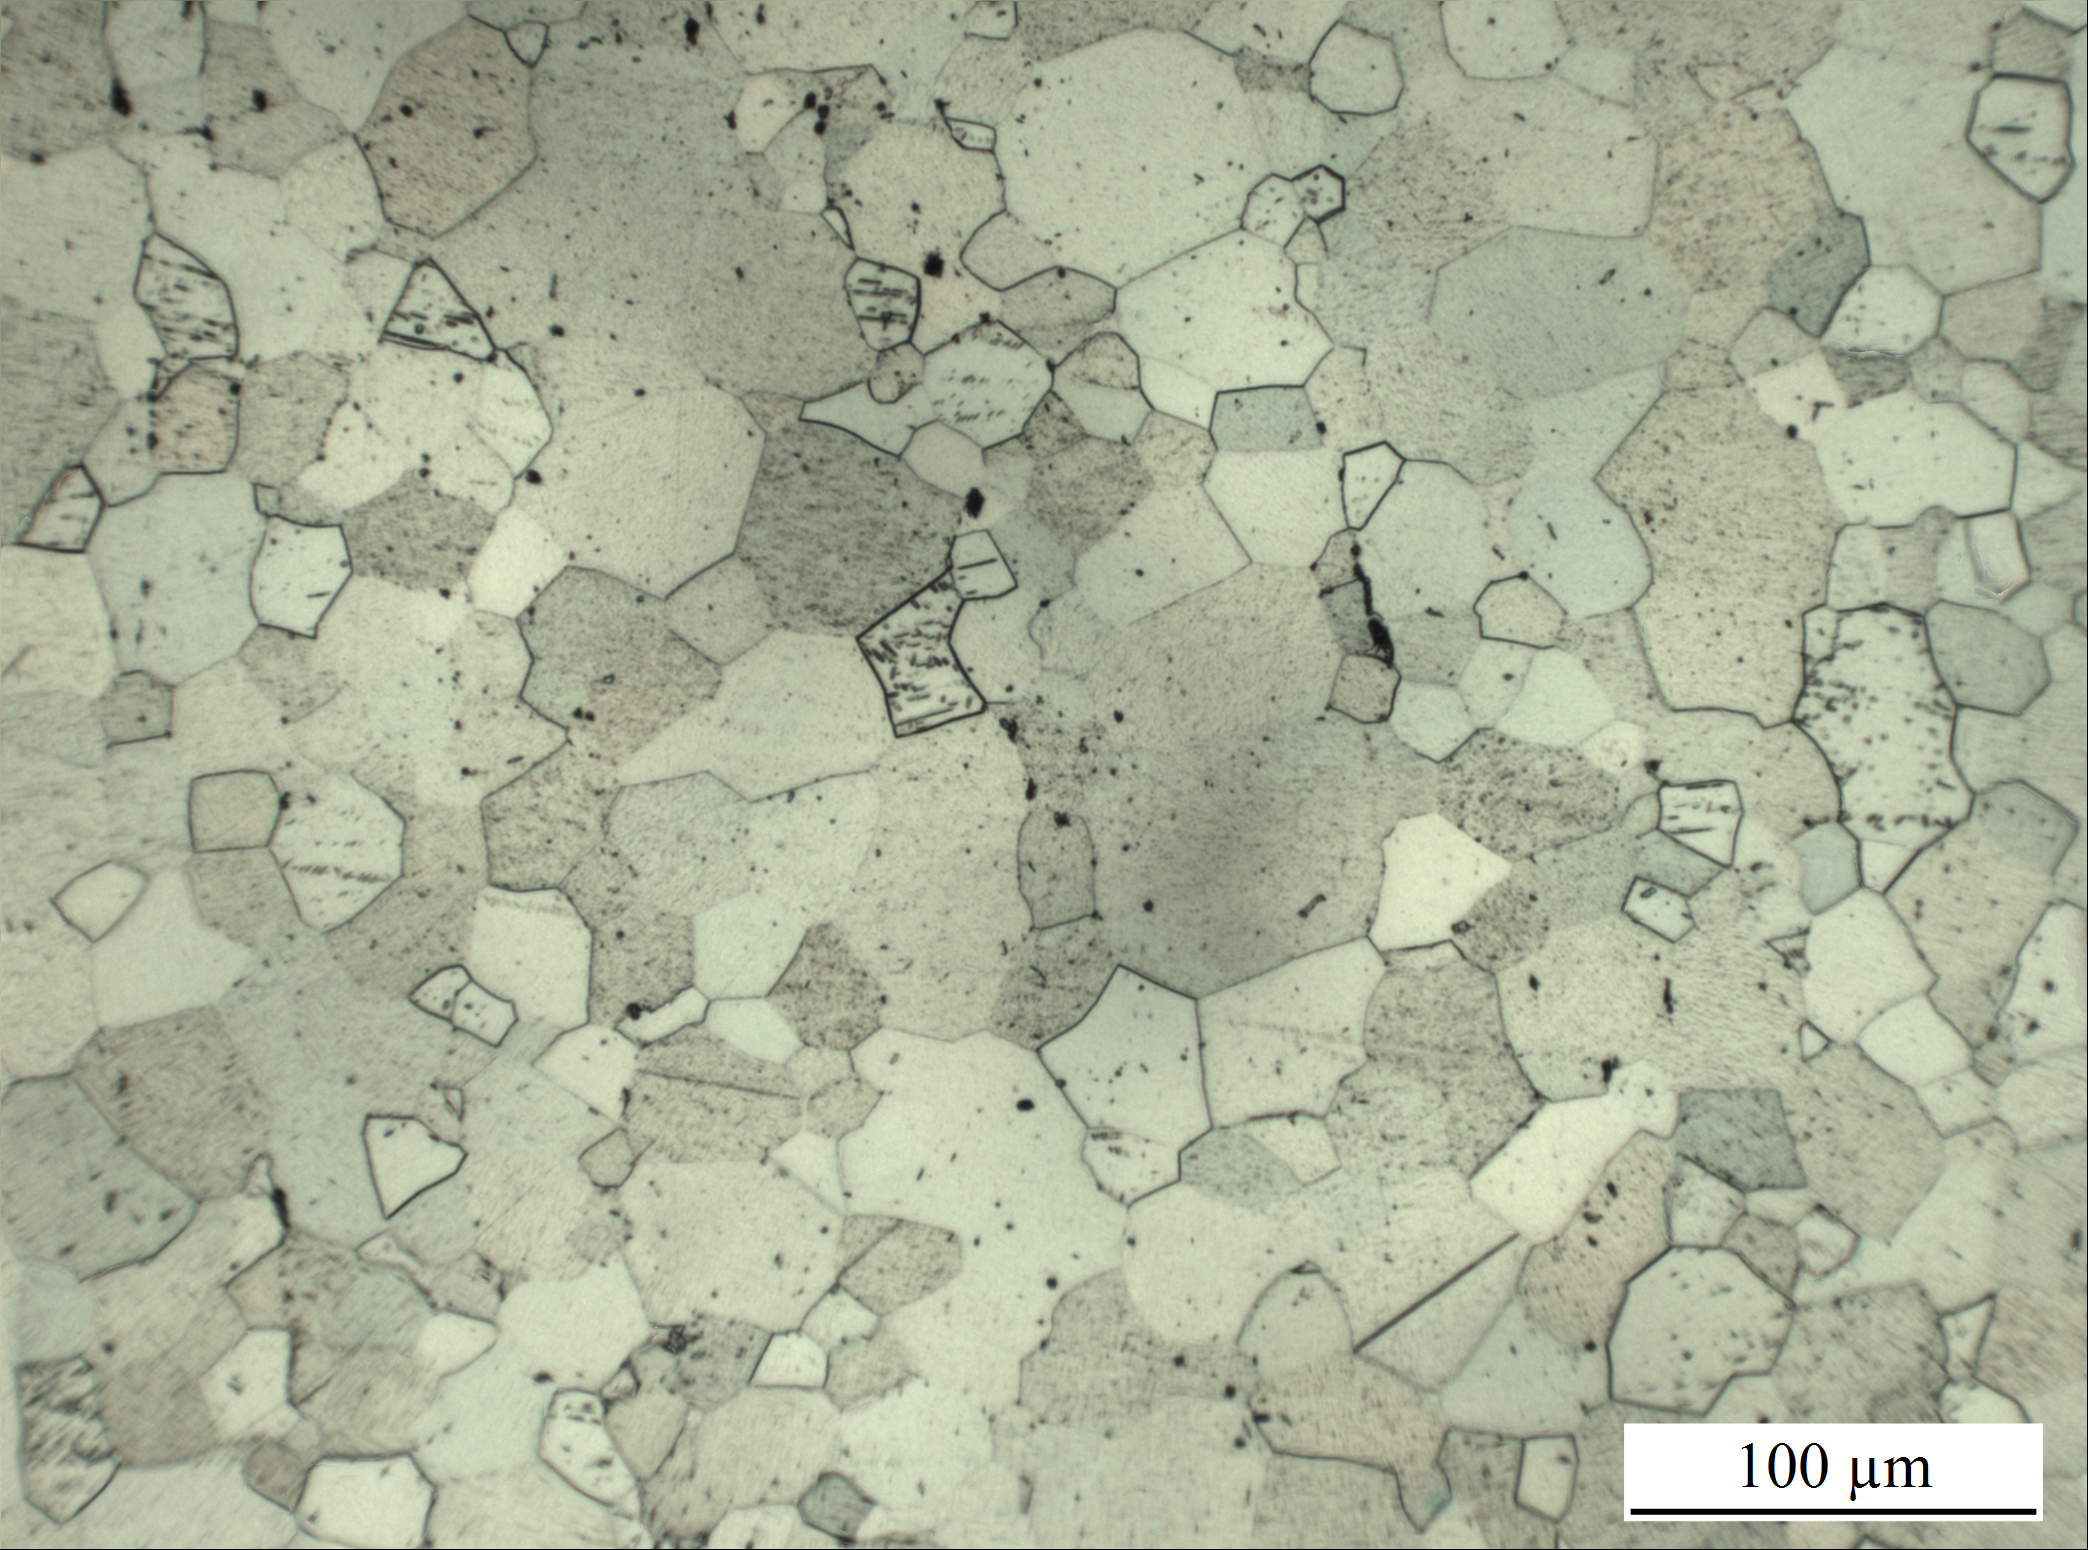
Machining experiments were performed on grade 5 commercial purity titanium. The initial microstructure has an average grain size of roughly 30-40 um and is shown below.
The experimental matrix varies the depth of cut (t) and surface velocity (V),
| V = 0.33 m/s | V = 1.00 m/s | V = 1.67 m/s | V = 2.33 m/s | V = 3.00 m/s | |
|---|---|---|---|---|---|
| t=0.1 mm | x | x | x | x | x |
| t=0.2 mm | x | x | x | x | x |
| t=0.3 mm | x | x | x | x | x |
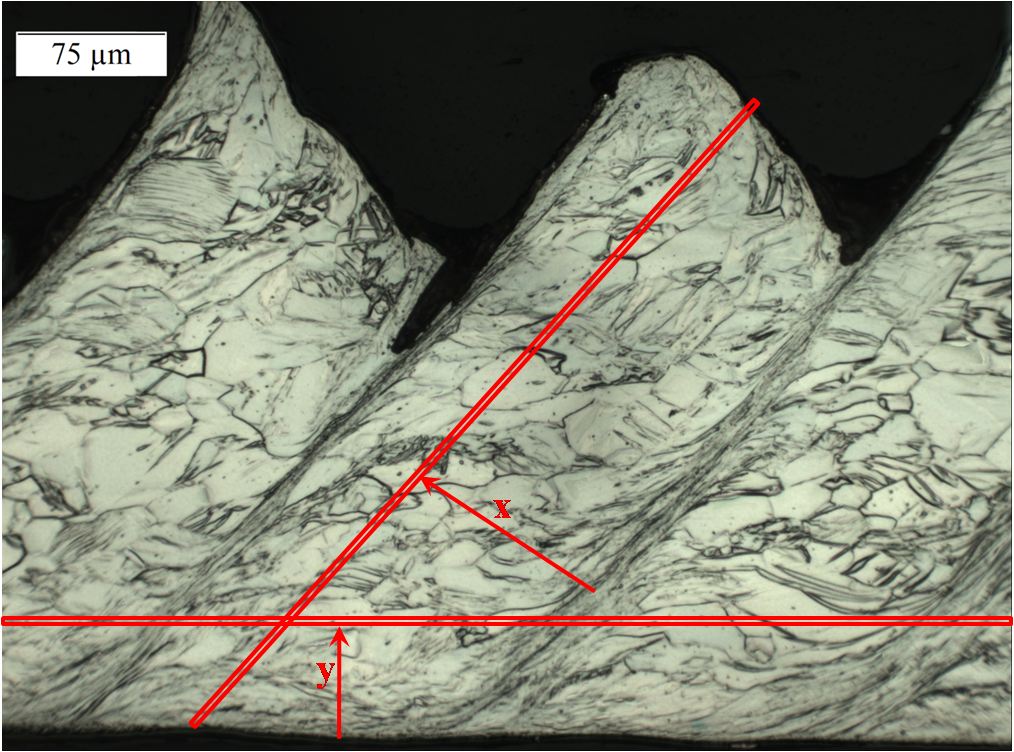
Chips collected from each experiment have been mounted, polished and etched to reveal phase boundary structure. A sample micrograph is shown below. All images were produced from optical microscopy.
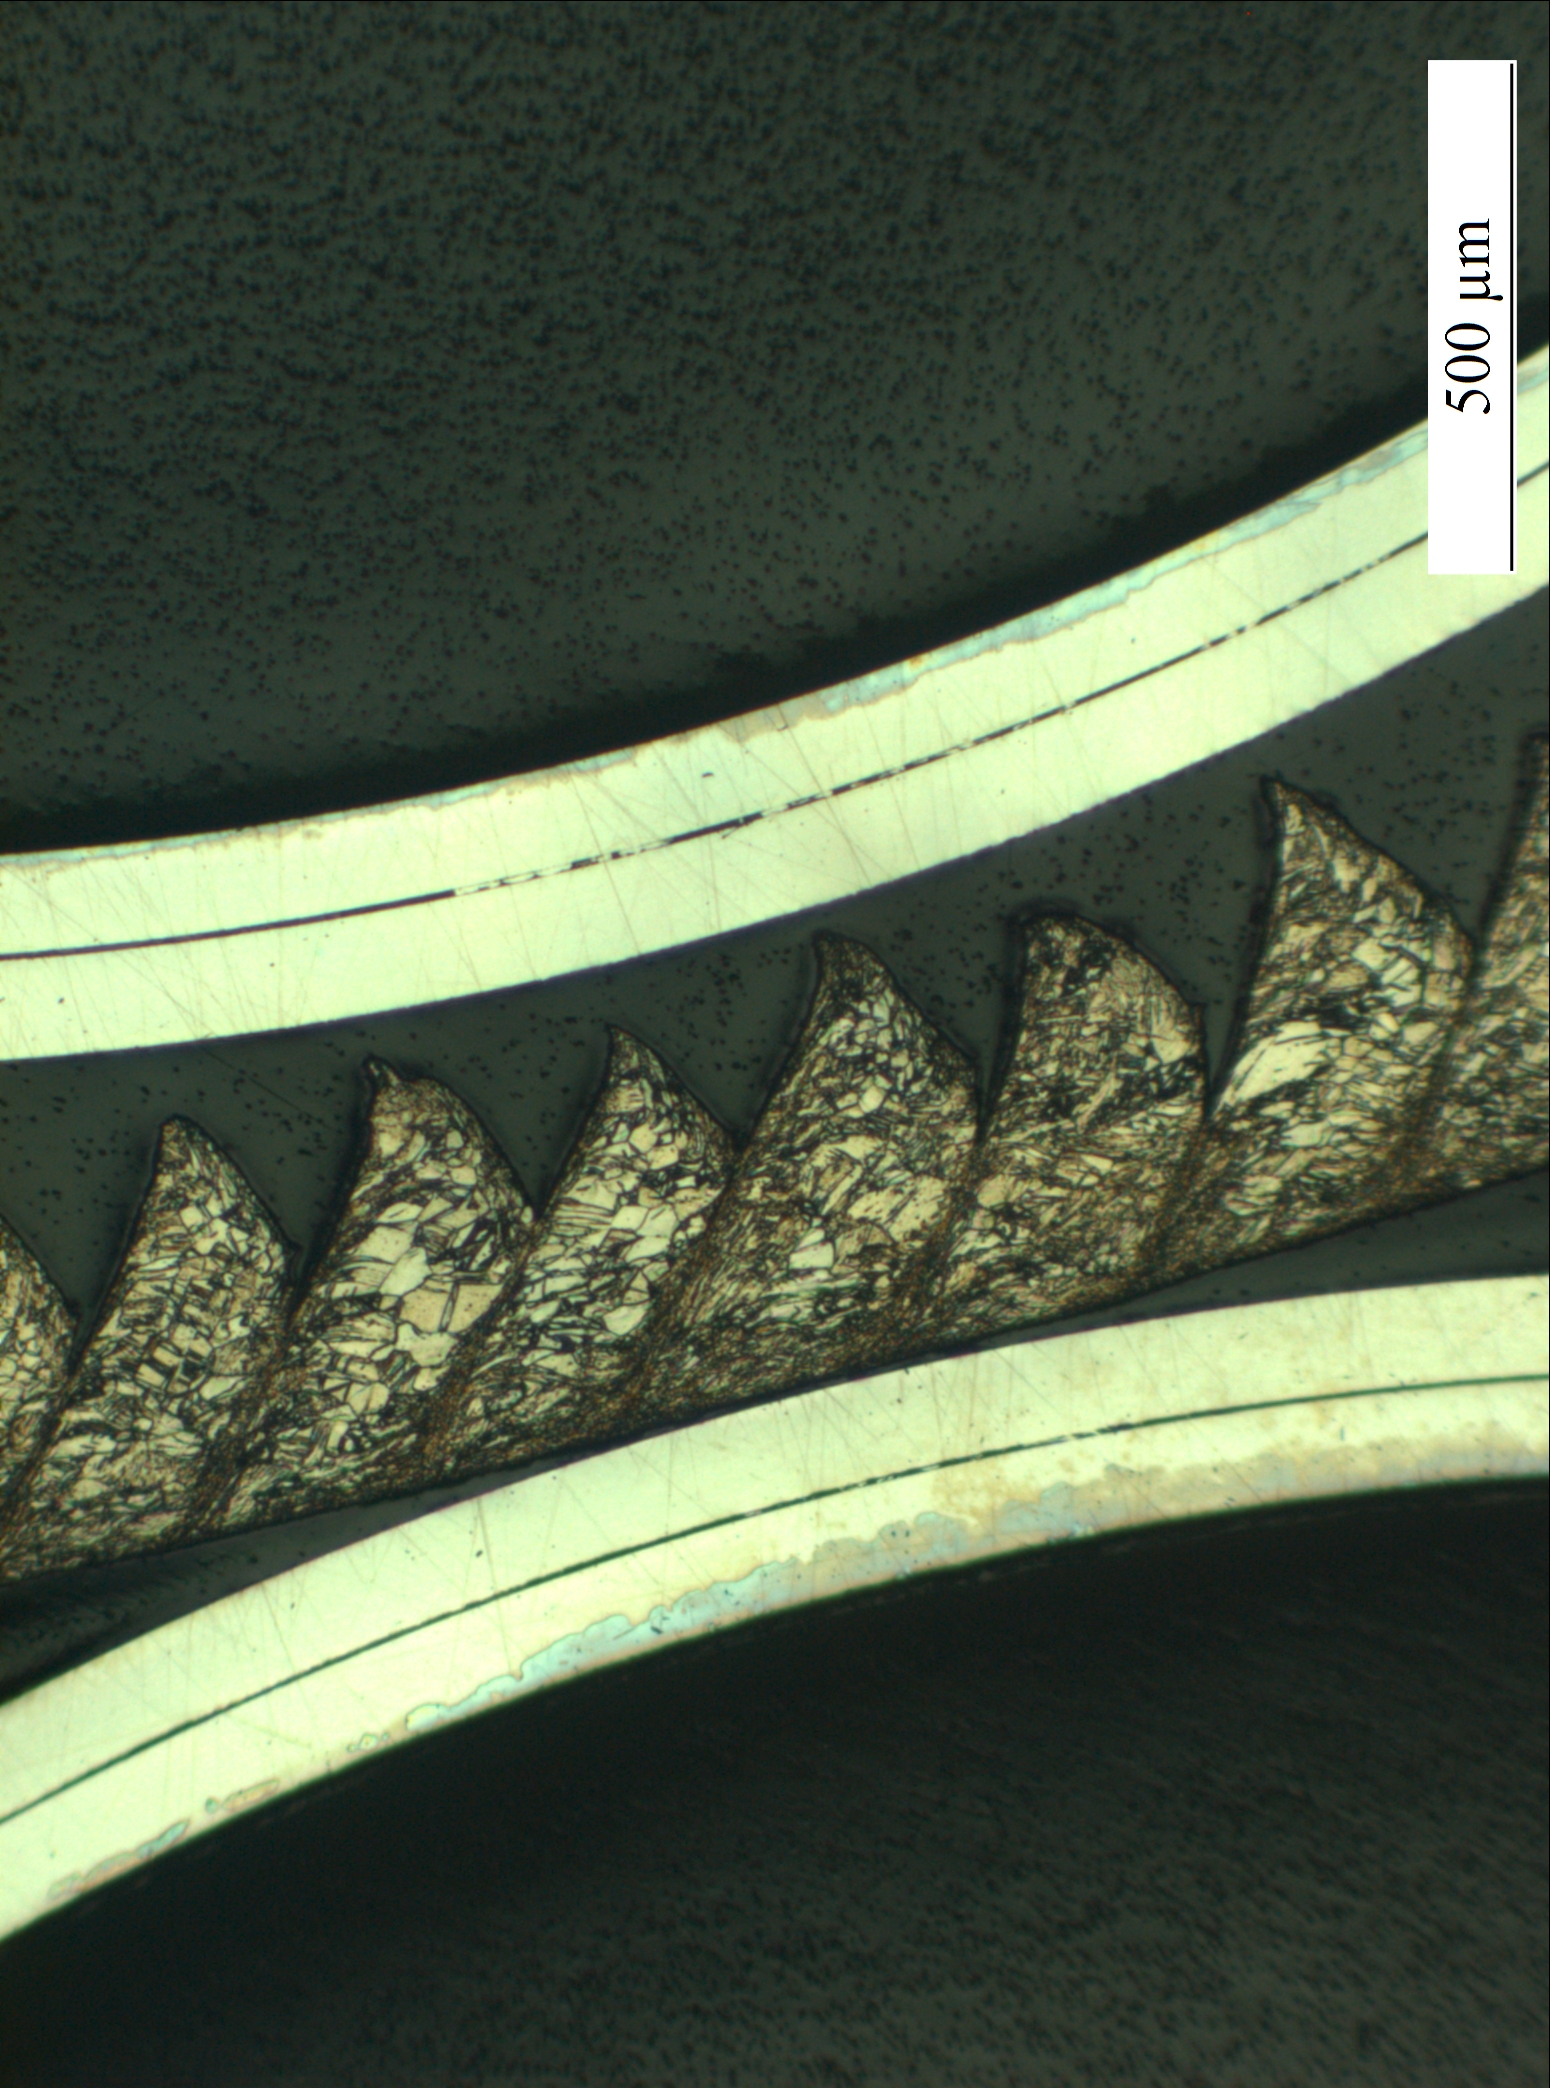
Note that the initial grain size is roughly 30-40 um and discernible features in the optical micrographs range from 1-10 um.
Methods sections
Given that images are limited by the resolution of optical microscopy the available quantifiable structure metrics are
- Grain size
- Grain morphology
A key issue of this problem is that there is a spatial variation in grain size scale from micron to nanometer scale (within shear bands). As such optical microscopy has limited utility for capturing nanocrystalline features.
The previous approach was to assume that a homogeneous region exists away from shear bands and to focus our efforts on these regions. This is shown schematically below.
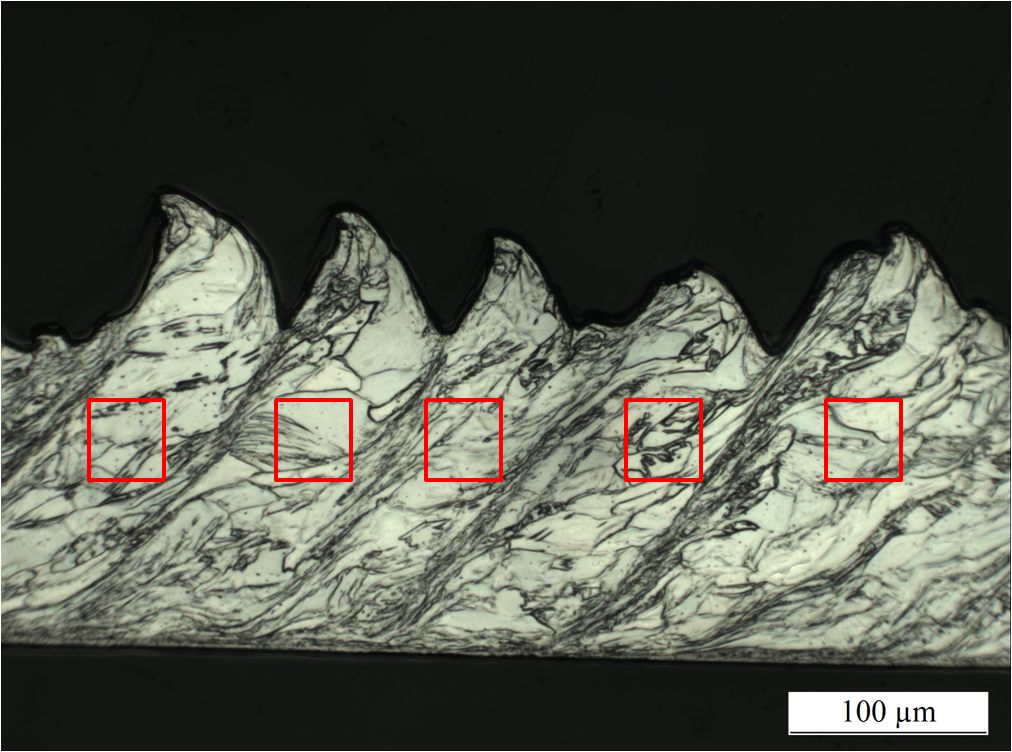
However this assumption may be poor as gradients are large not only between shear bands but also traversing the specimen from bottom to top.
A revised strategy is to address the gradients directly by assuming the following coordinates which are normal to the gradient features.
The plan for quantifying structure statistics is to:
-
Segment micrographs - Processing images to identify phase boundaries (twins or grain boundaries).
-
Quantify statistics - Use n-point statistics to explore process-structure linkages and quantify the relevant microstructure function(s). This will also include reducing the order of the statistics possibly through principal component analysis (PCA).
Deliverables
- Generate segmented data set from micrographs
- Extract pathways in n-point statistic space corresponding to specific processes